[Infographic] Histograms for Beginners
Like your camera, most photo editors include a histogram function. And Zoner Photo Studio is no exception here. Do you know the right way to work with a histogram?
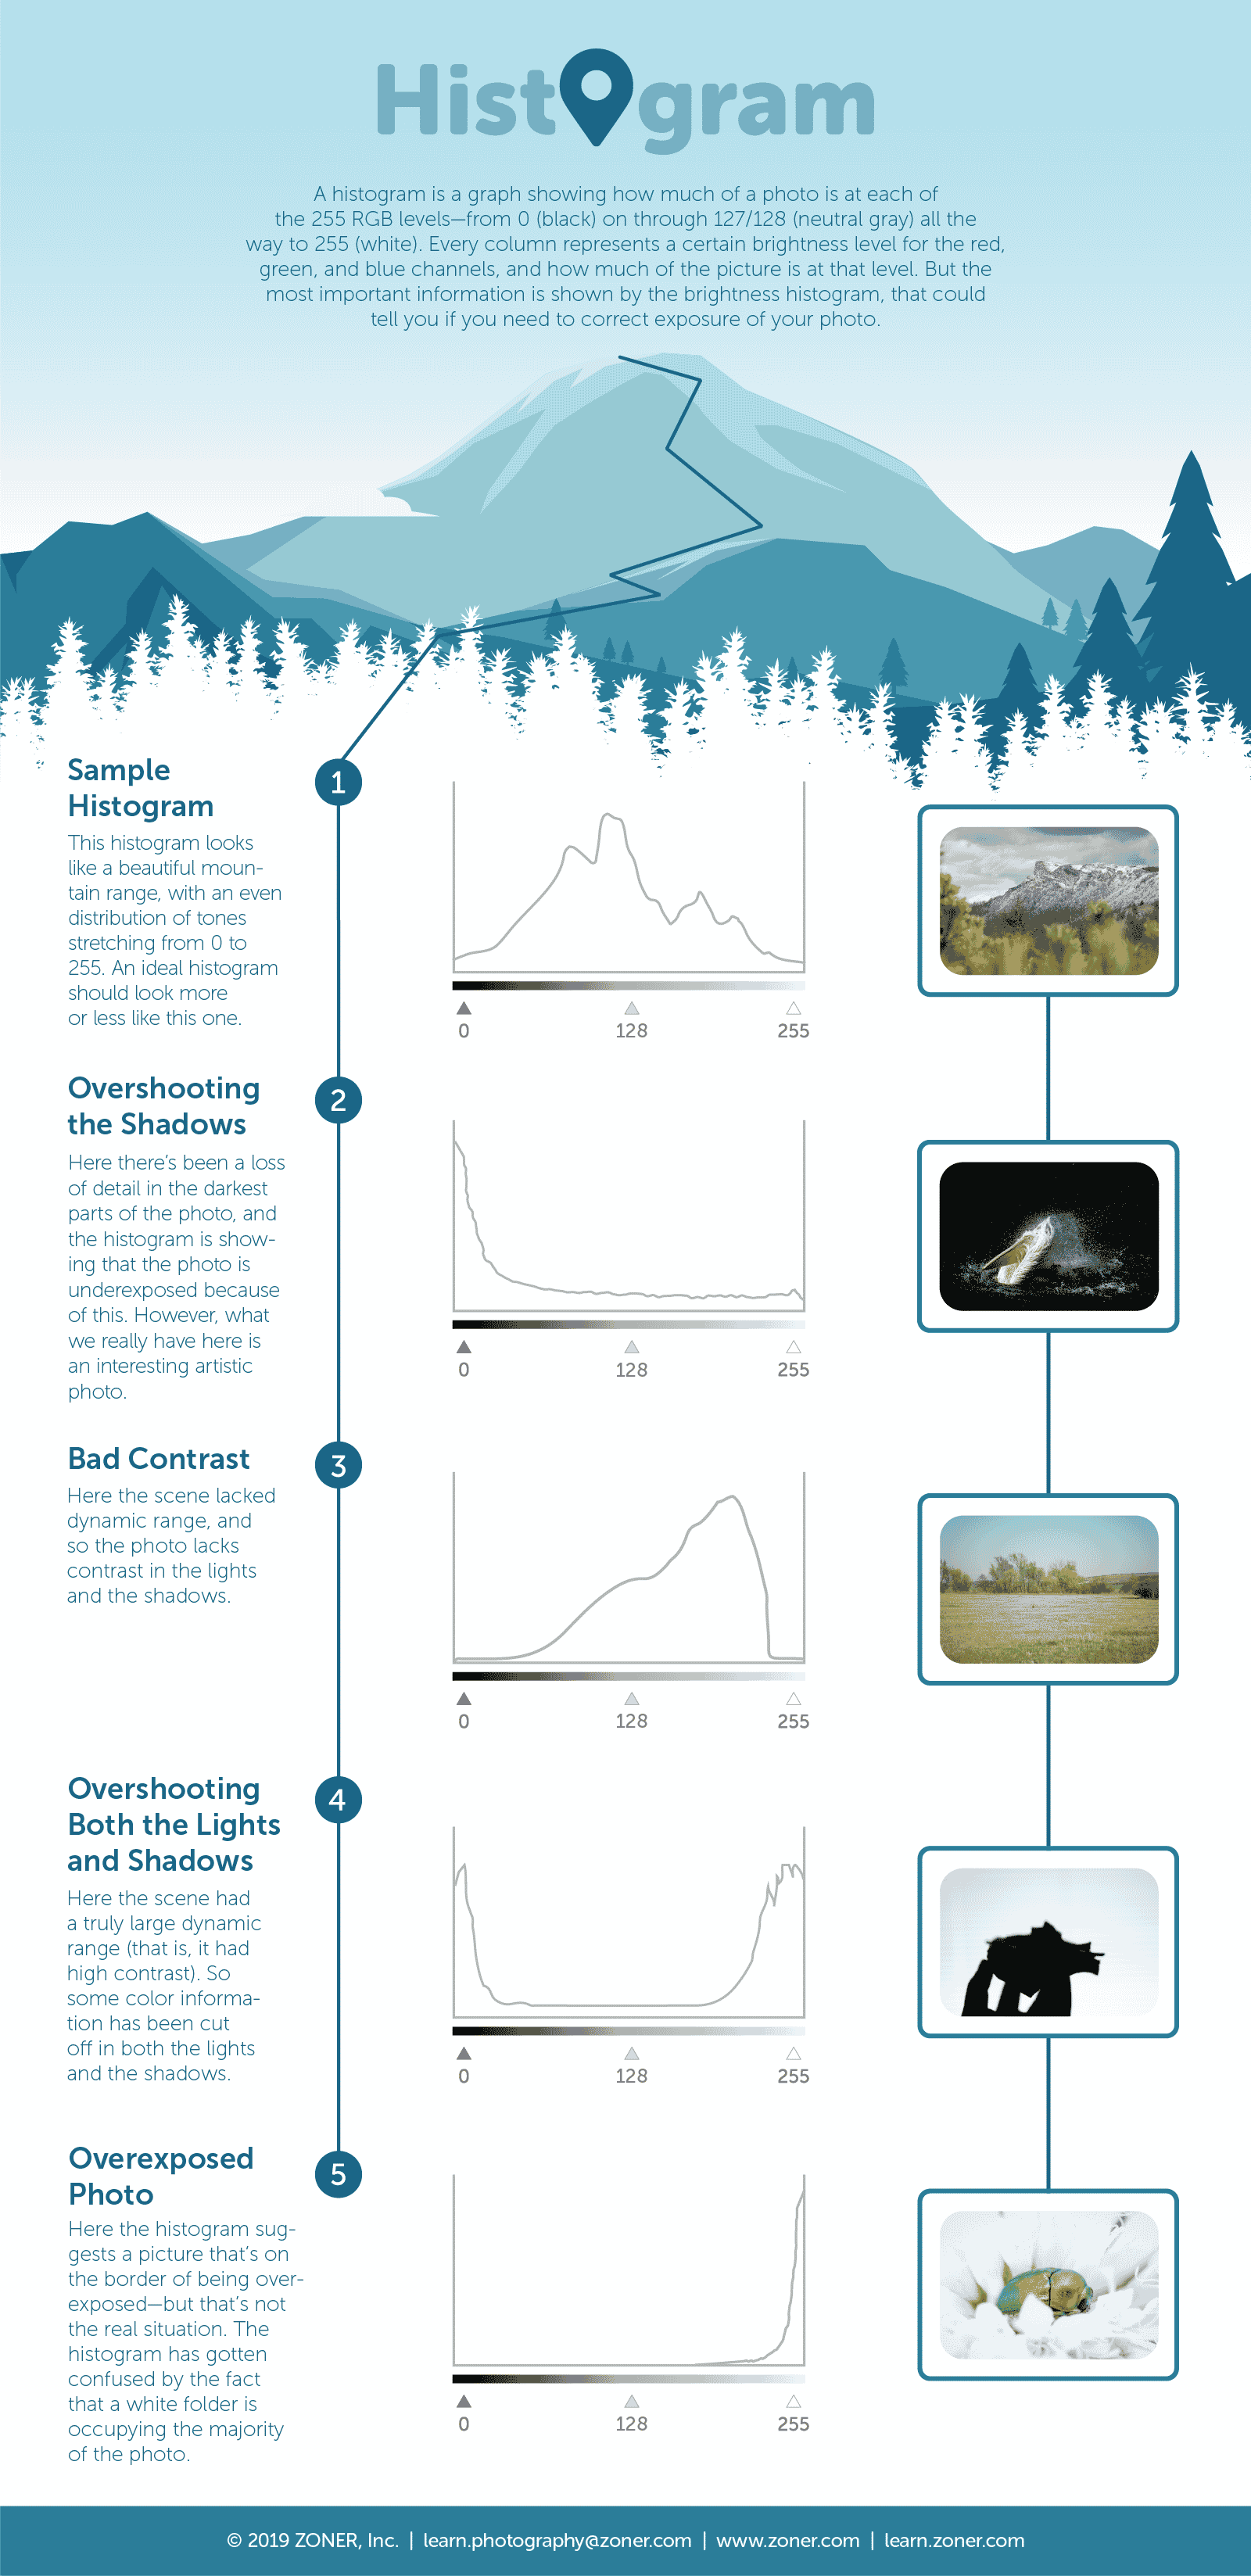
Most photographers use brightness histogram the most—mainly for checking whether a photo has been exposed correctly and whether there’s been any underexposure or overexposure in the shadows or the lights. These two problems cause a loss of detail. The following infographic has several examples that will show you how to work with the brightness histogram.
You can also download this infographic as an easy-to-print PDF. Just click the button below:
There are no comments yet.