How to Use the Histogram for Photo Editing
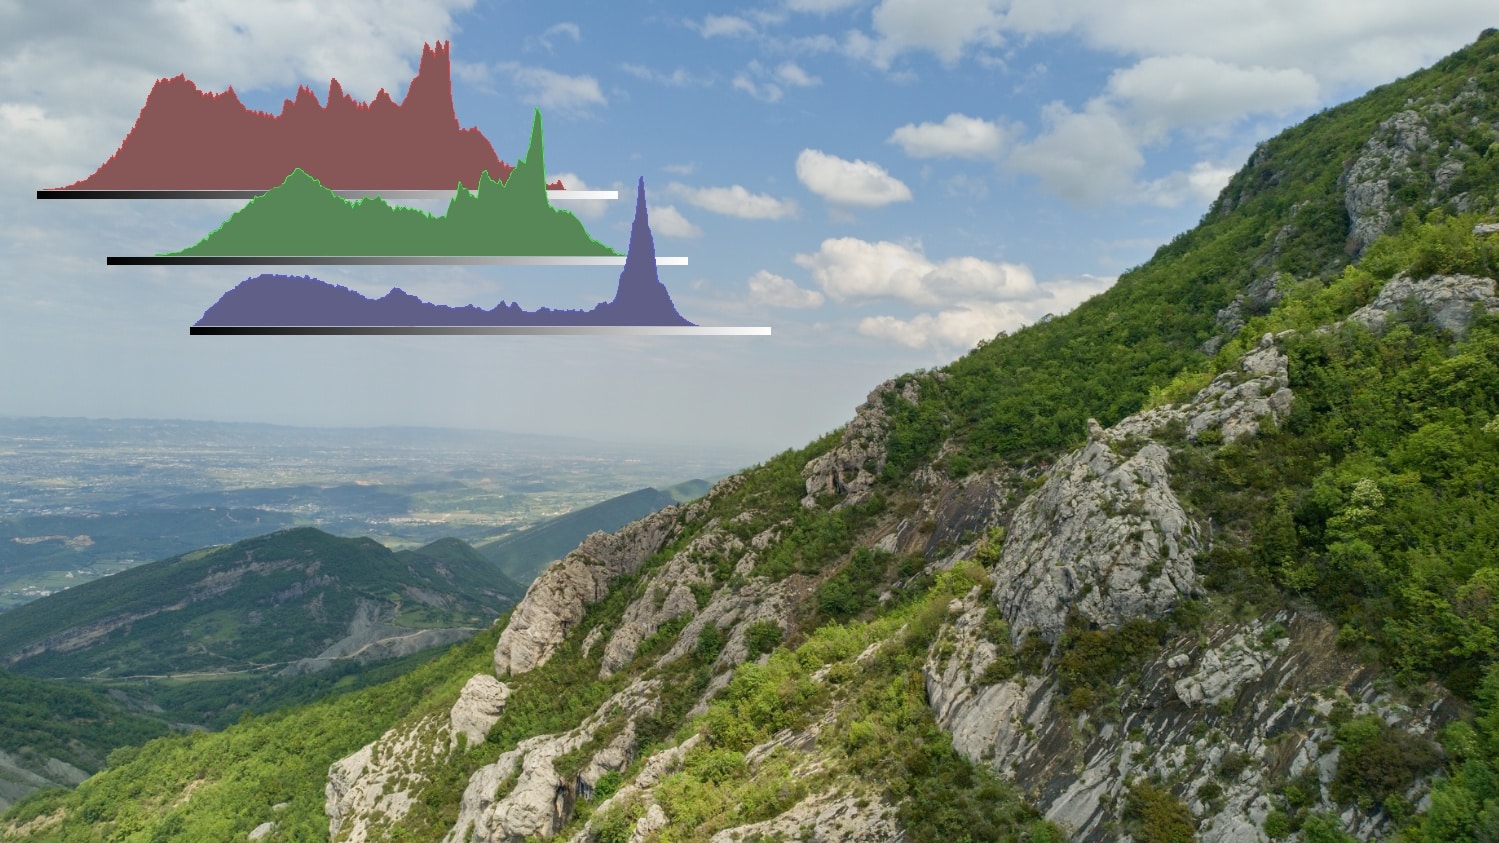
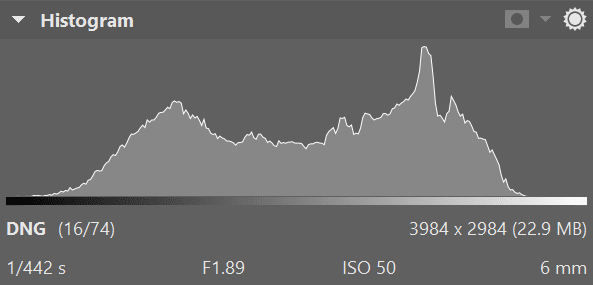
The histogram is a graph that shows the light and color values of an image. It also gives us information about an image’s Exposure. The left side of the horizontal axis of the Histogram contains information about the darkest areas of the image, while the brightest areas are on the right. The vertical axis indicates the extent to which these areas appear in the photo.
We’ve already explained how to use the histogram in your camera. Now let’s see how to utilize it when editing photos in Zoner Studio.
Customizing the Histogram to fit your needs
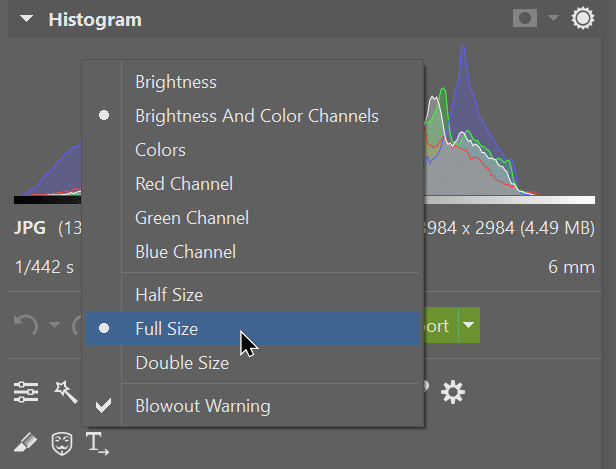
You can find the histogram in Zoner Studio at the top right of the Manager, Develop, and Editor modules. You can right-click the Histogram to see the drop-down menu and different customization options.
First, you can adjust its size. You can choose from three options: Half, Full (default), and Double Size.
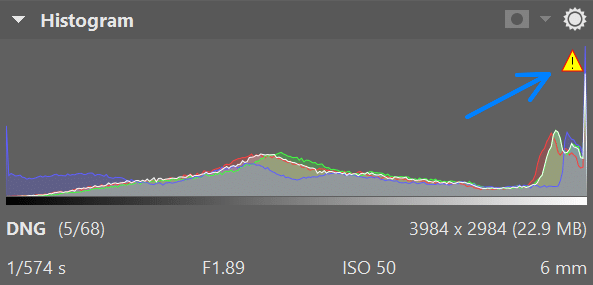
It’s also a good idea to enable the Blowout Warning option. If there are any blowouts in your photo, a small exclamation mark will appear in the top right corner.
You can also configure what components the histogram displays. By default, it shows Brightness and all color channels. You can also display these components separately. But what is the purpose of this? Brightness is self-explanatory. It shows you the areas and intensity of the bright and dark areas of a photo.
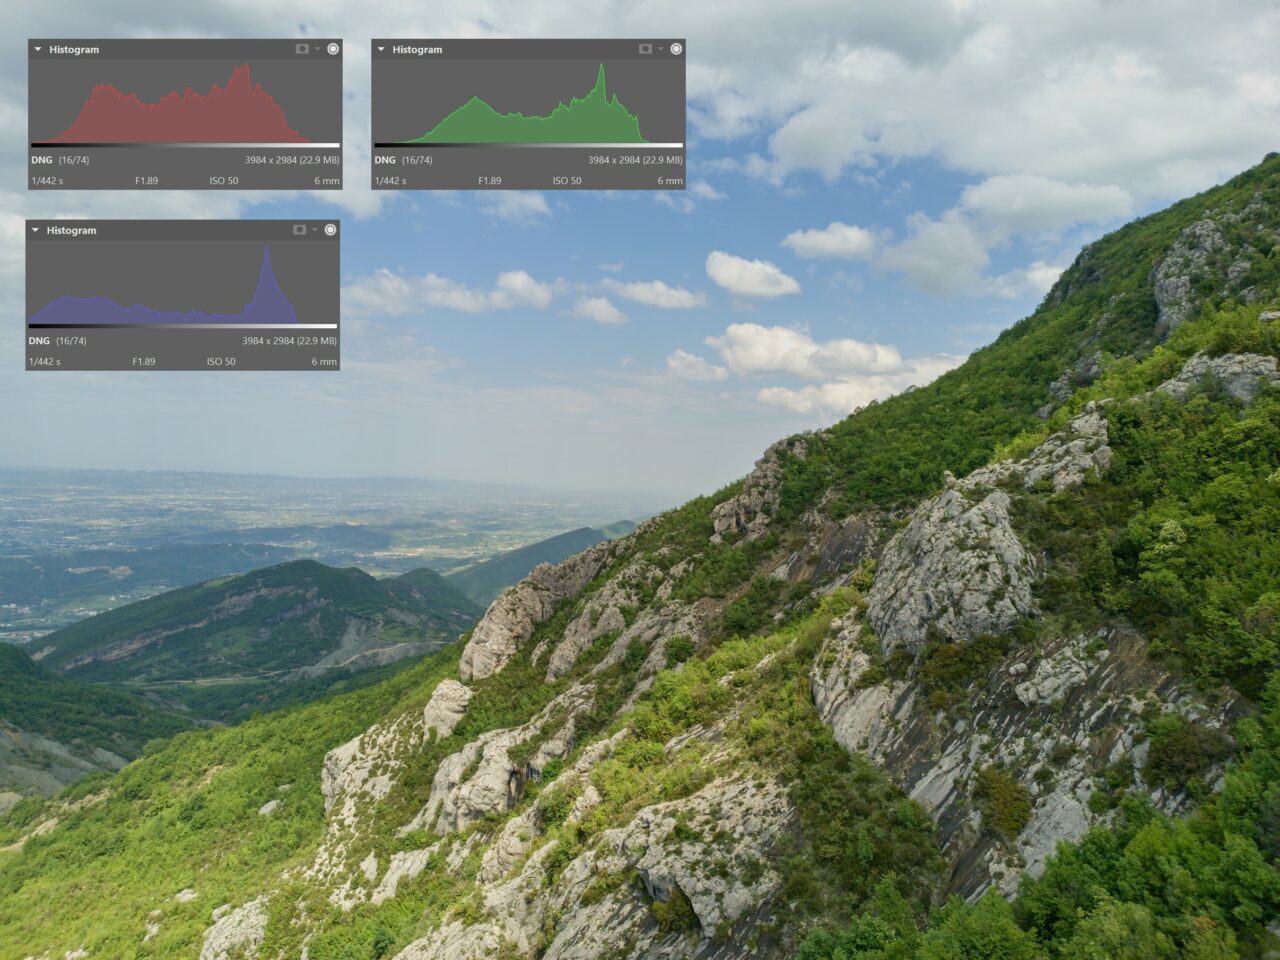
The individual color channels show where each color is most prevalent, either in the dark or bright areas. In this photo’s histogram, we can see that reds and greens are predominantly in the middle, while blues appears mostly in the brighter areas of the photo.
If you want to adjust these colors, use the Tone Curve. Simply switch between the different channels, allowing you to color balance the entire image and have control over the image’s colors, all using the Histogram.
Check out our video on using the Histogram, and don’t forget to download Zoner Studio for a free 7-day trial and see for yourself how the Histogram works.
