How to Read a Histogram
You may not have realized it, but you can find a histogram in every camera. Even in the lowest models. Photo editors, including Zoner Photo Studio, have histogram displays too. But do you know how to use a histogram well?
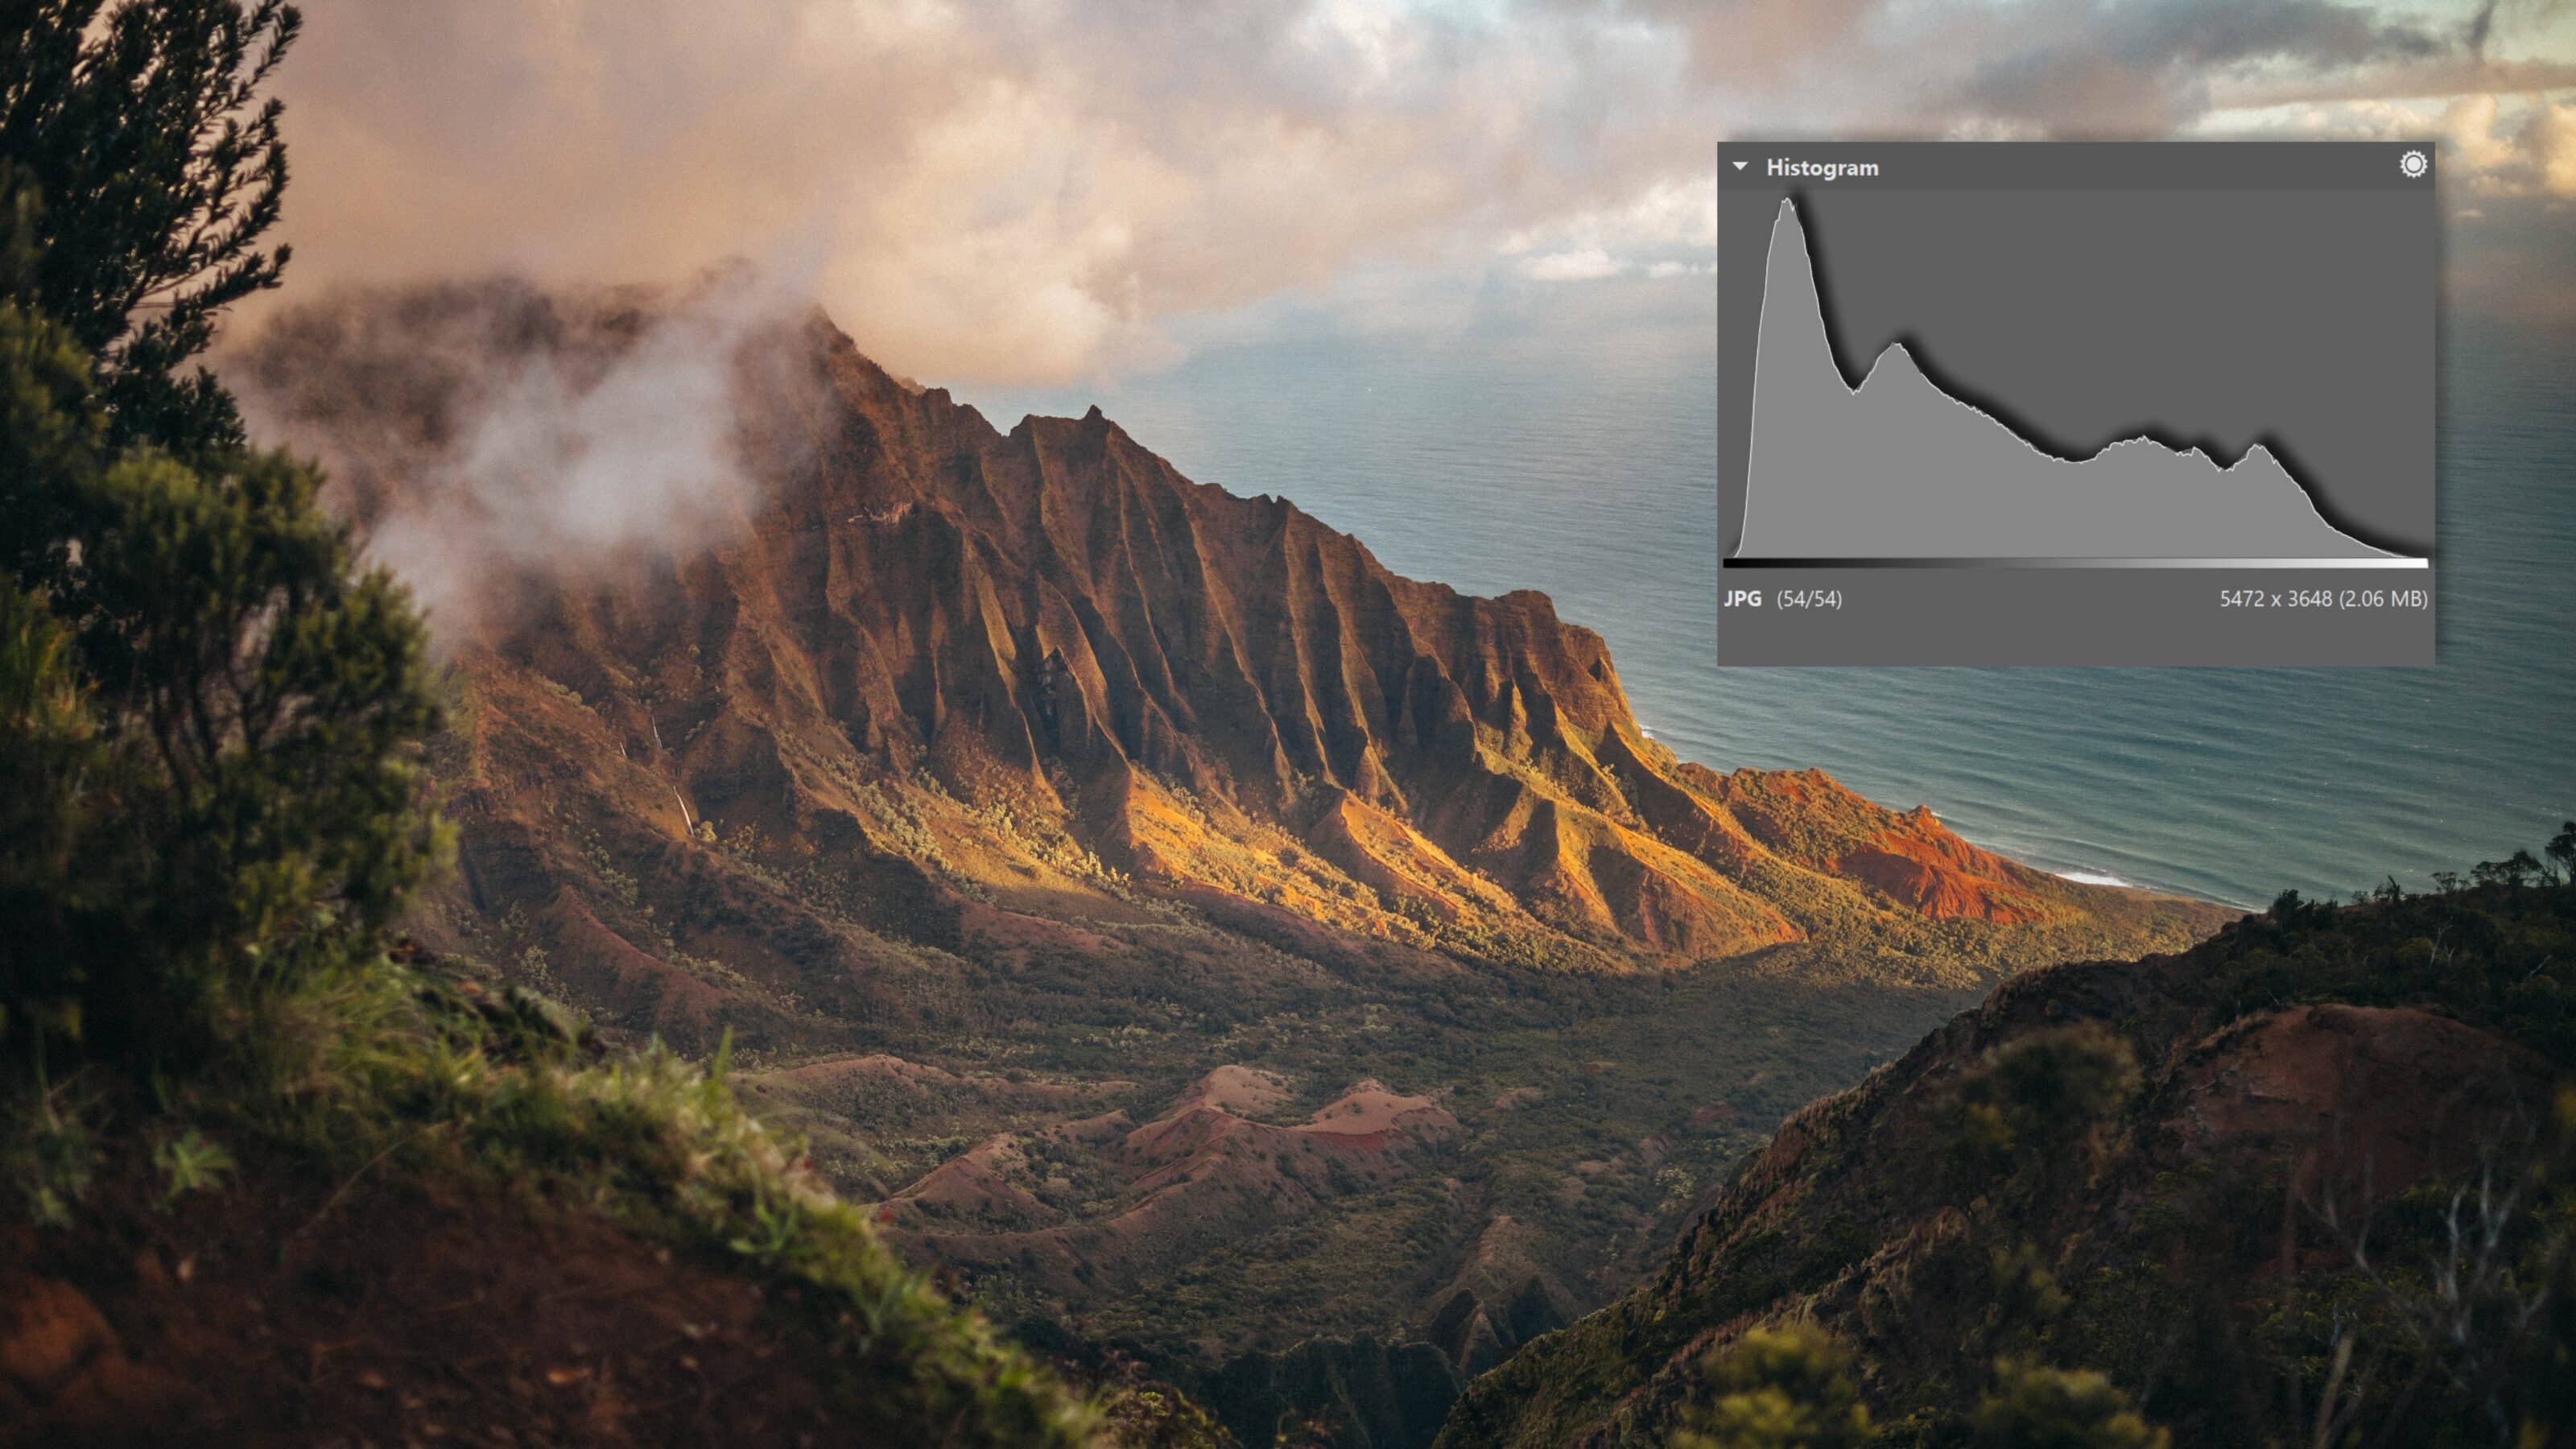
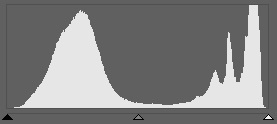
A histogram is a graph showing the 255 brightness levels—from 0 (black) on through 127/128 (neutral gray) to 255 (white)—for one or more of the RGB (red/green/blue) channels. Each column shows a certain brightness level, typically for red, green, and blue combined.
Thus it typically shows an overall-brightness histogram. Most photographers use this type the most, mainly to check whether on not a photo is properly exposed at all 255 levels and to catch photos that suffer overexposure or underexposure in the lights or shadows. They make those checks because these problems cause a loss of detail.
The Ideal Histogram
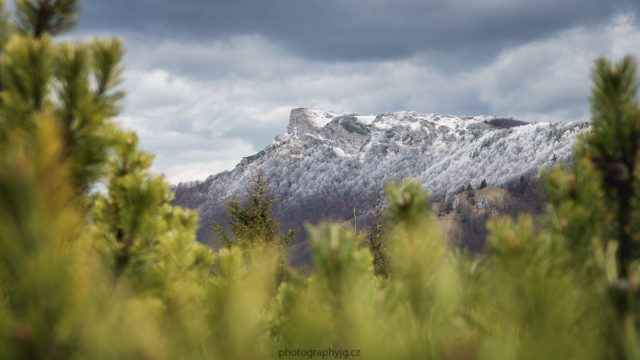
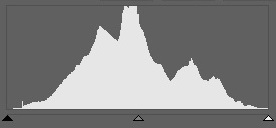
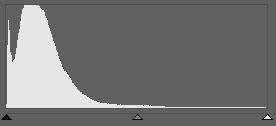
Some photographers are of the opinion that the ideal histogram should look like a hill. But in reality there are many ideal histograms. It all depends on what you’re photographing at the moment.
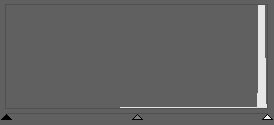
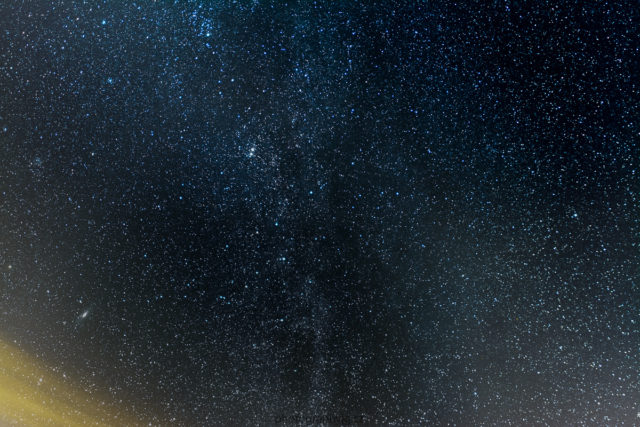
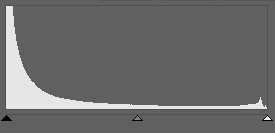
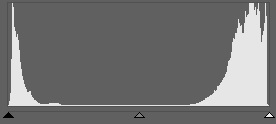
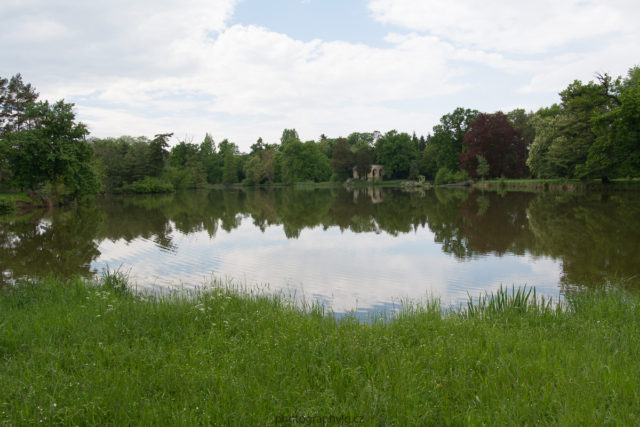
If you’re photographing stars, you’ll want a histogram on the border of overexposure, so that you can get the most out of the stars and minimize noise. If you have a histogram like that in a landscape photograph, however, you risk erasing the sky from the picture. It will be totally overexposed.
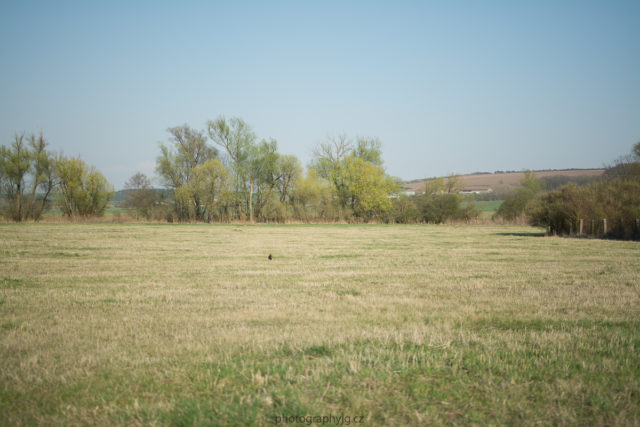
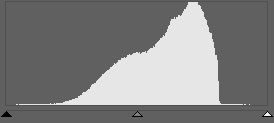
So in landscape photography, you want to maintain as much information as possible, evenly all the way from your whitest white to your blackest black. That will minimize the amount of overexposed and underexposed areas in your photos.

The In-camera Histogram
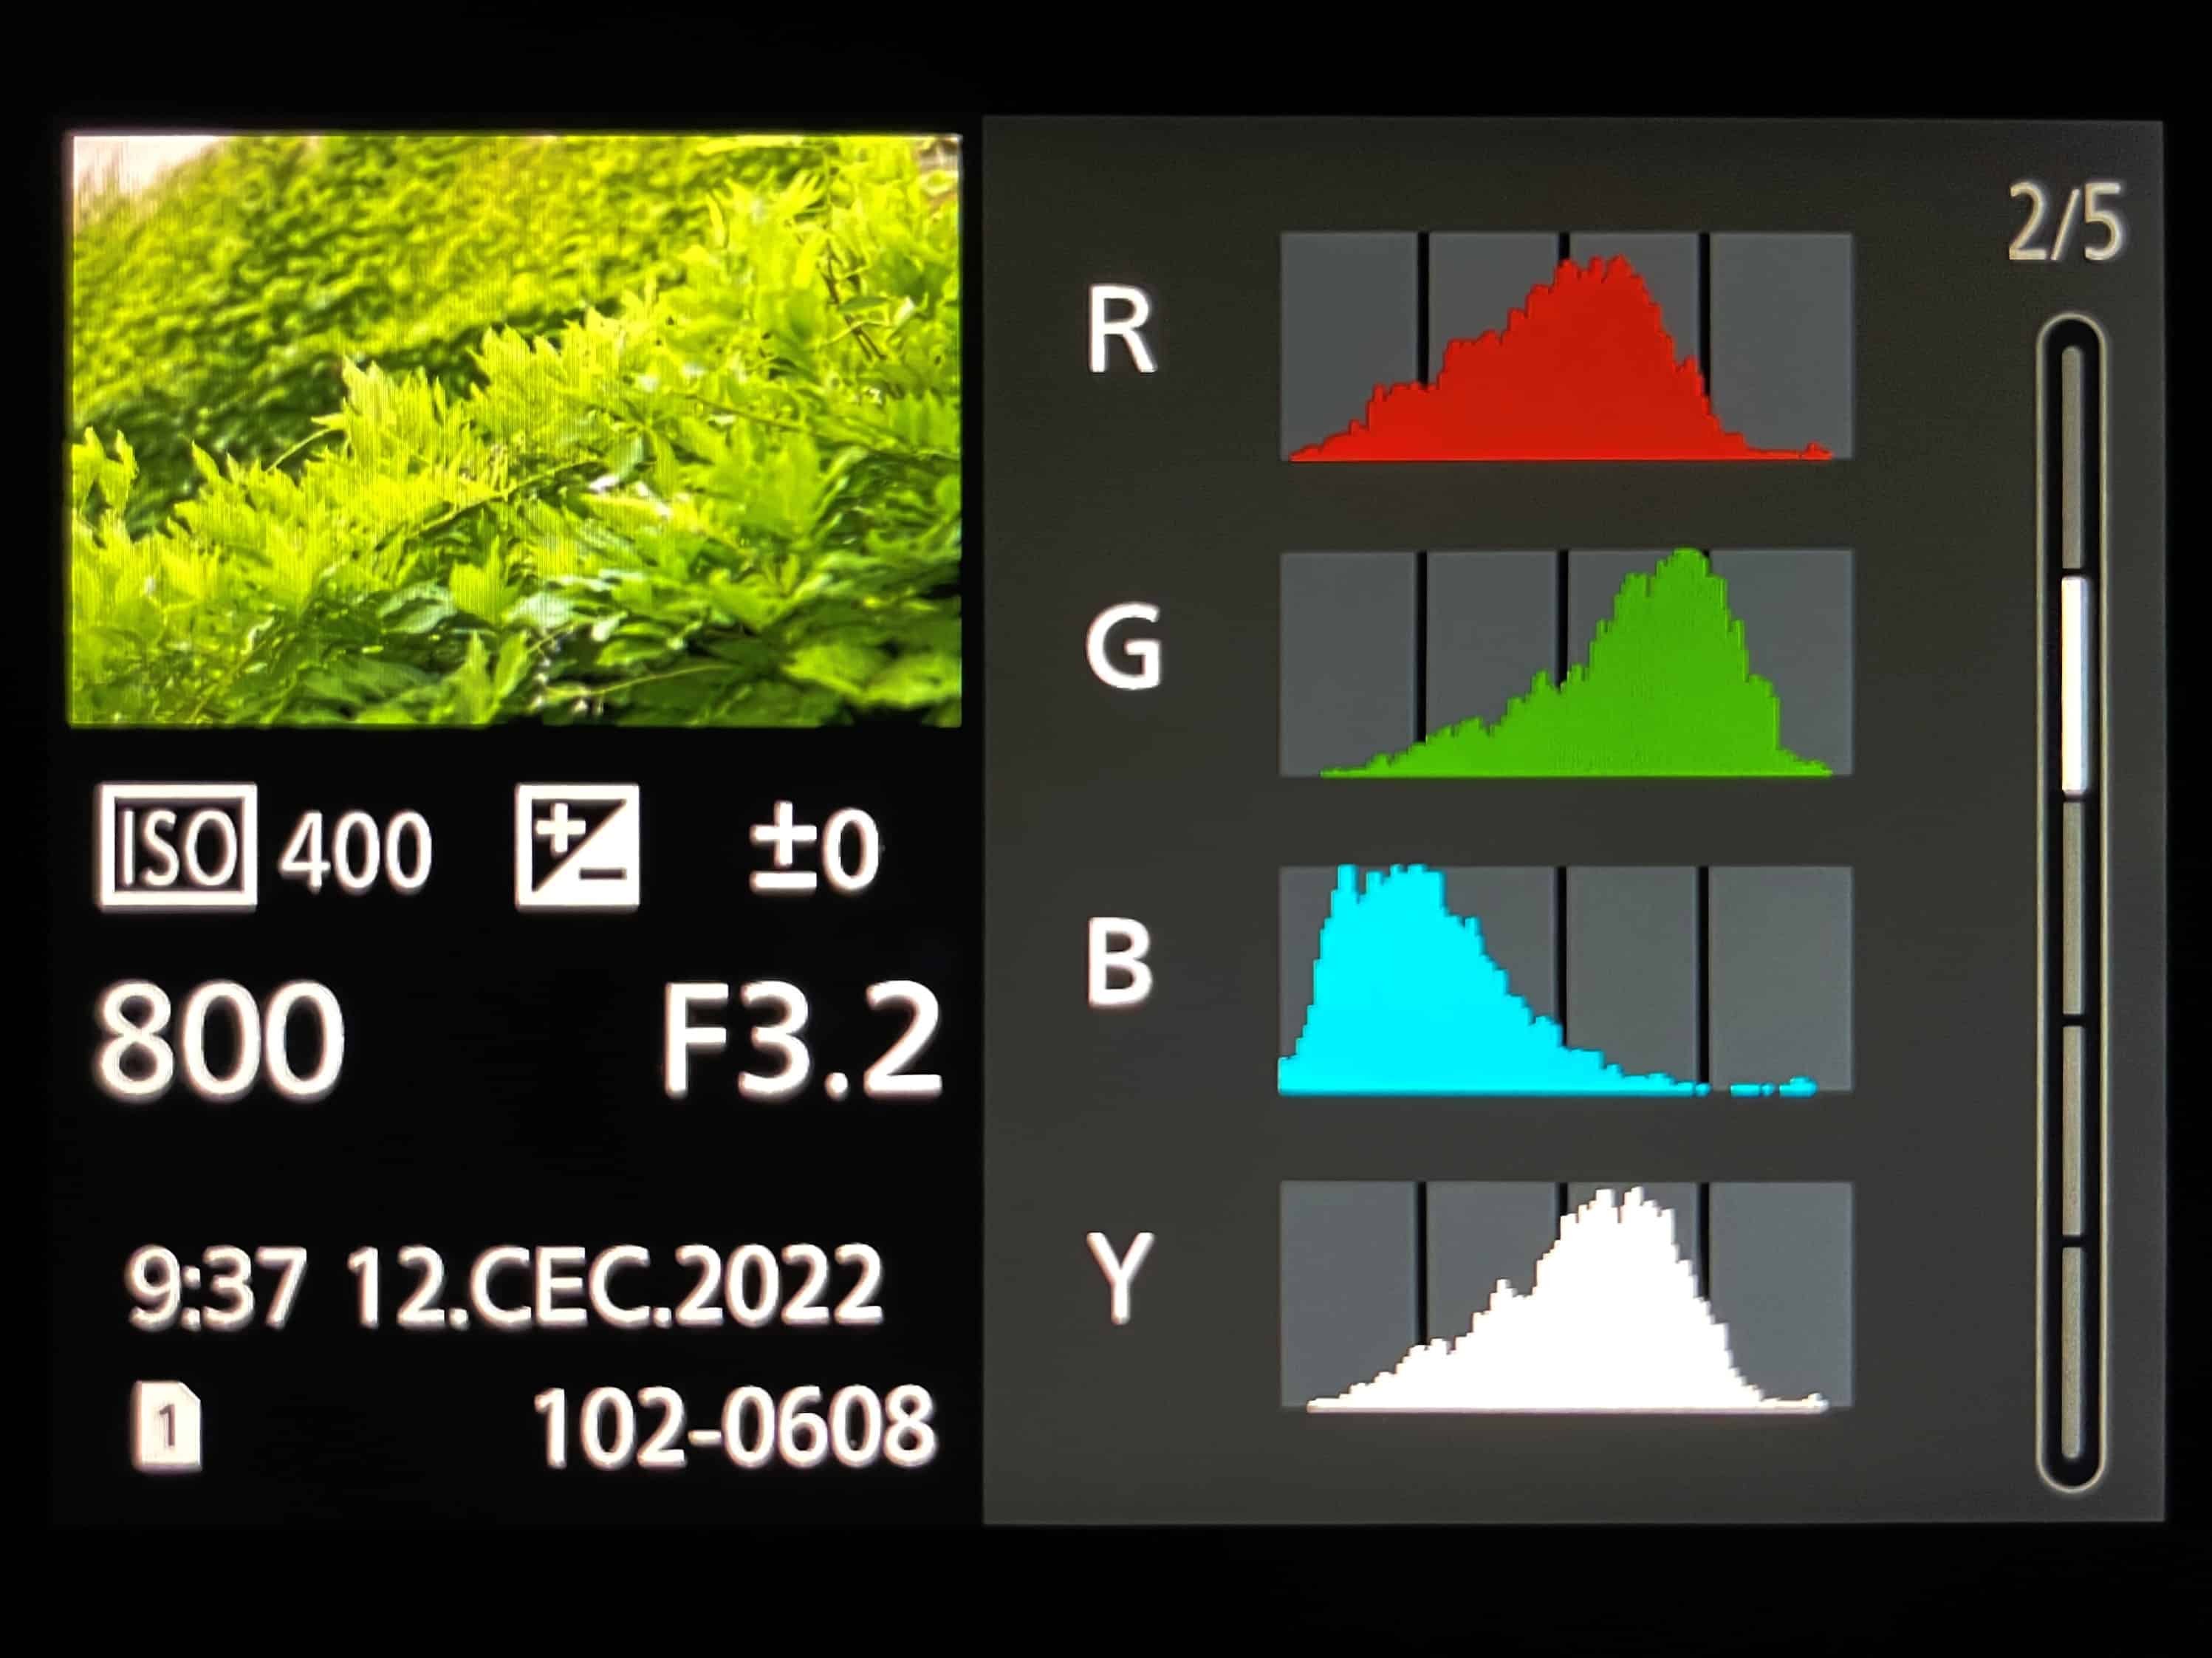
Most cameras can show histograms after your shot, both for overall brightness and for the RGB channels. Most modern cameras, and especially mirrorless cameras, can also show the histogram when you’re shooting through the digital viewfinder. This is called a “live histogram.” Professional DSLR cameras, meanwhile, show the histogram on the camera’s display during the live preview.
Thus the in-camera histogram serves for checking overexposed and underexposed places in a photo. You’ll especially appreciate it in situations where, for example, it’s too bright out to see your picture on the display.
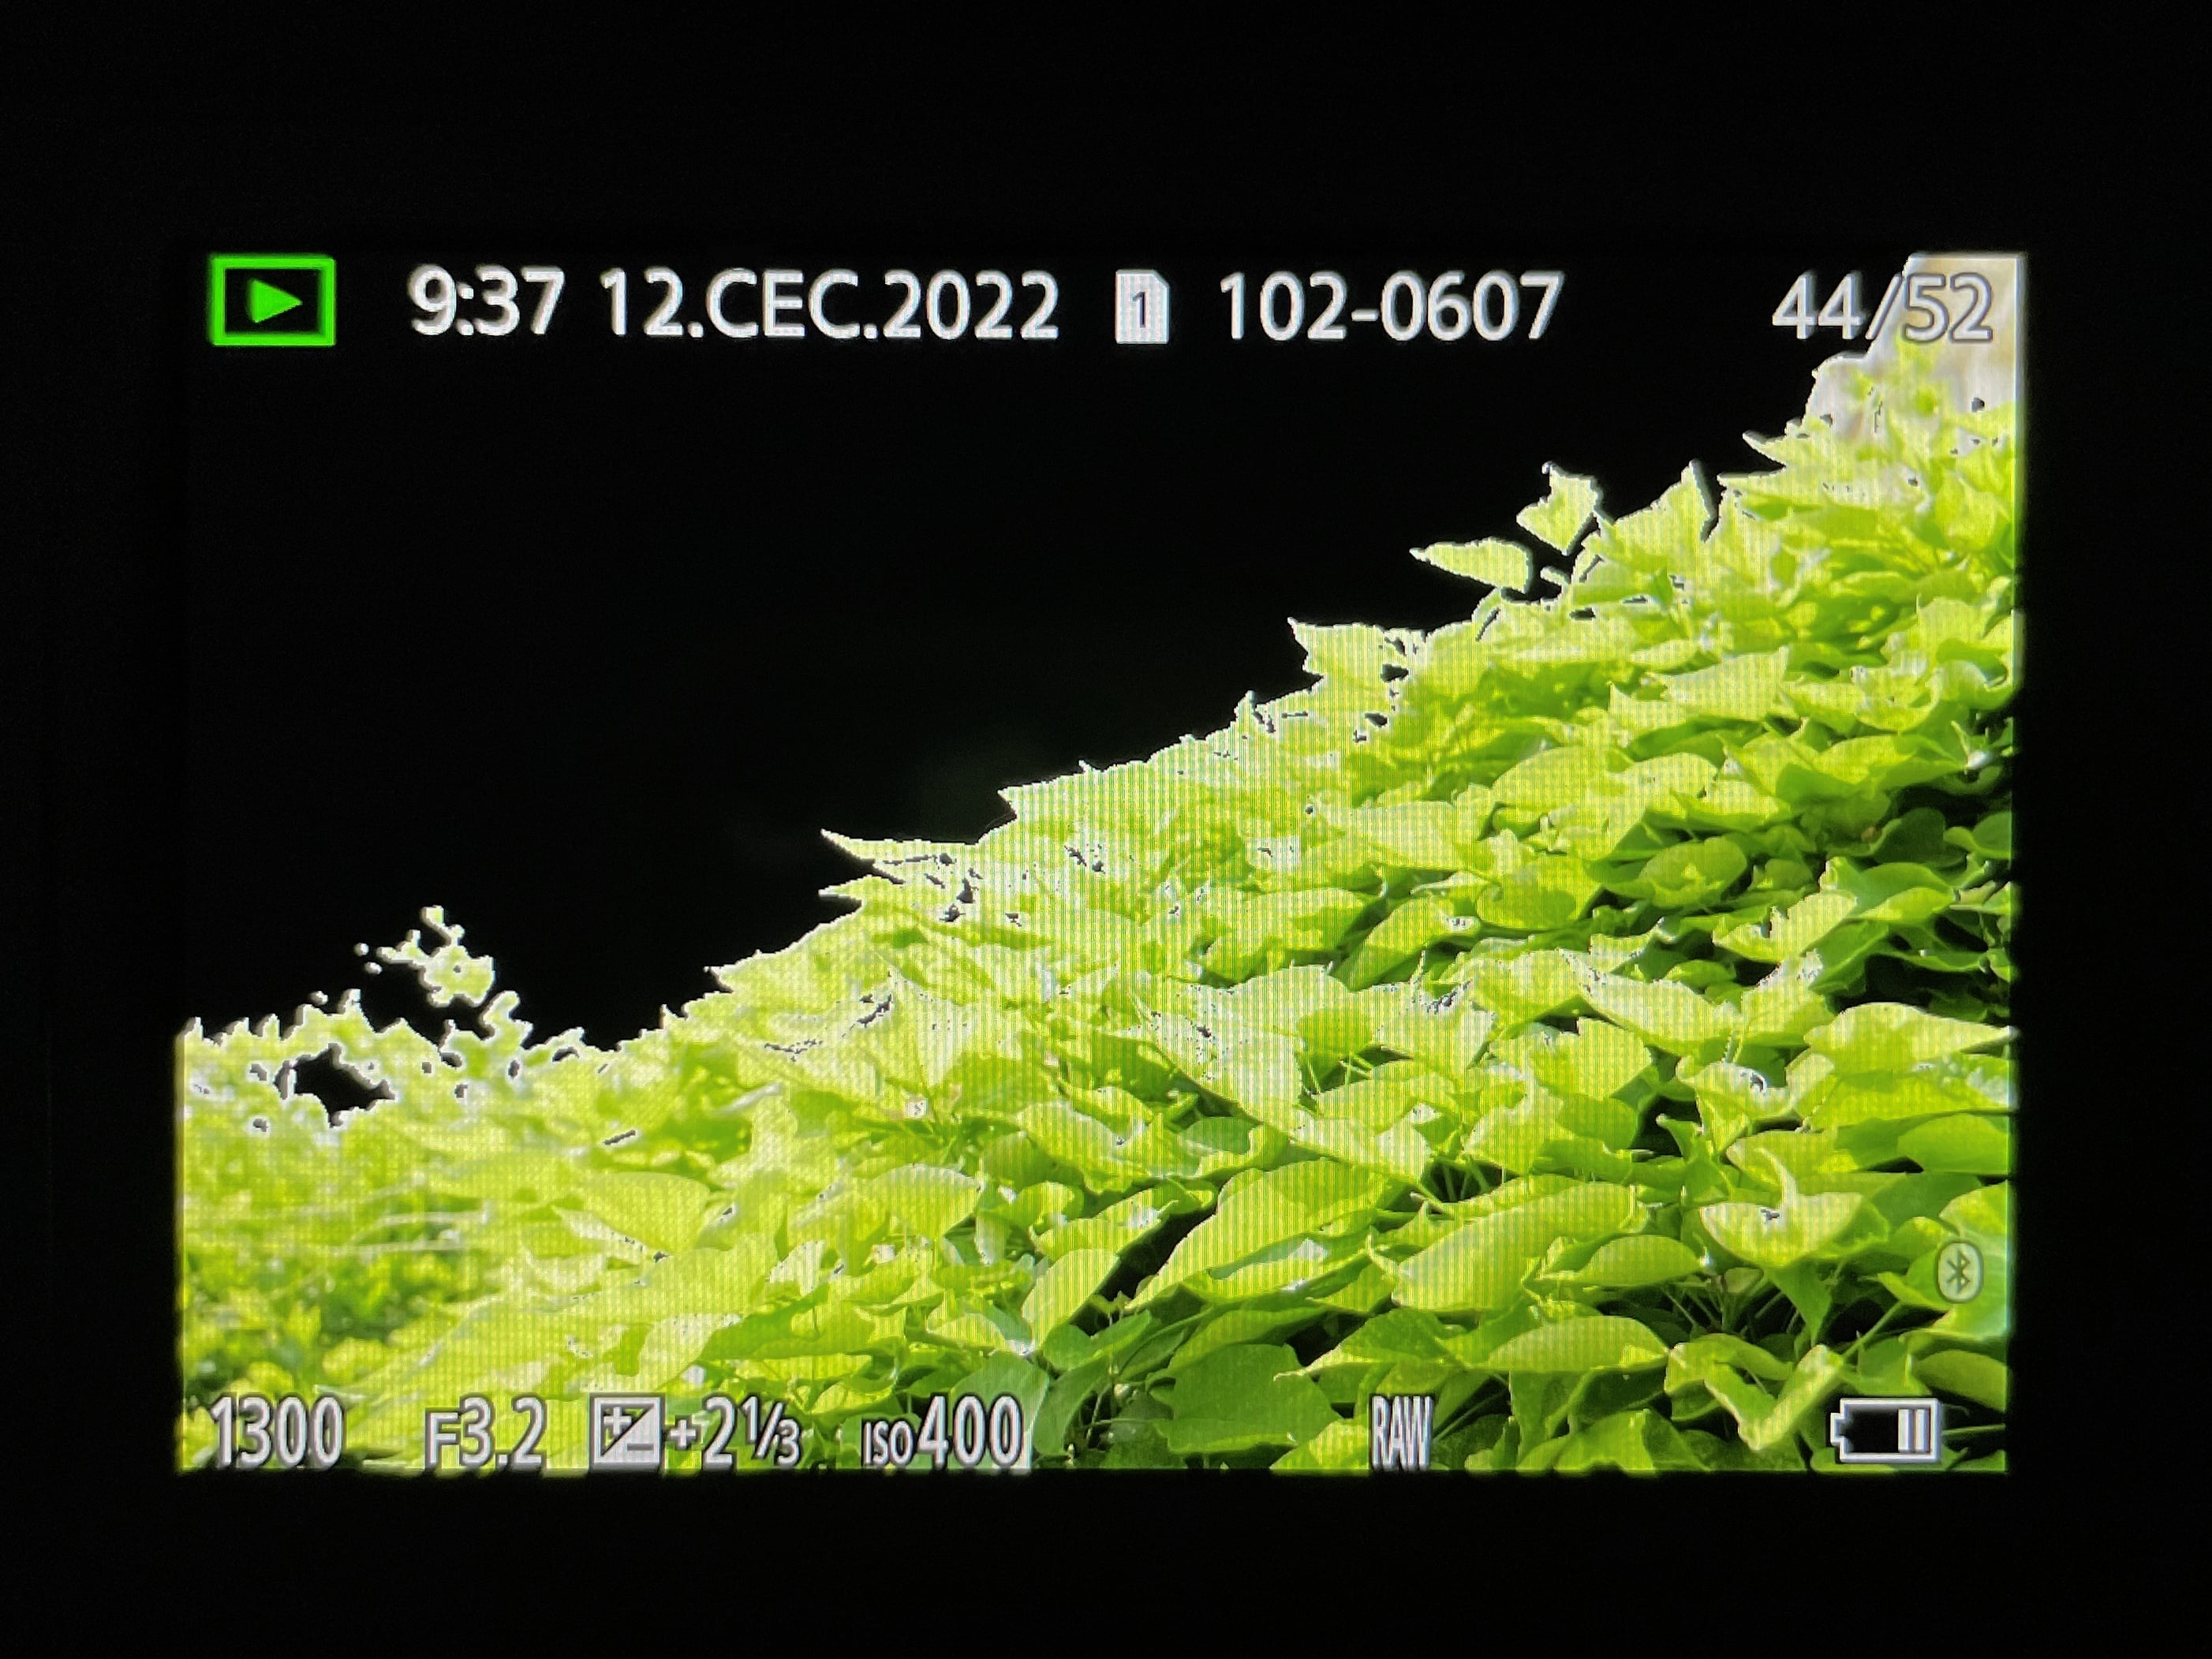
There’s also a display of the brightest spots in a photo—a useful tool for checking the photo. That’s because it will show you which spots are overexposed. For a guide to showing this information on your camera, see its manual.
For example on my Nikon D3100 and D7100, I can see the histogram after showing a picture, pressing the Info button, and then pressing the up arrow on the options cross. In the camera’s menu, I can also set what information I do or don’t want to show for photos. You’ll definitely have similar possibilities.
The Histogram as a Photography Aid
Using the histogram right while you’re taking pictures is a good idea, but take note! Don’t make the histogram a dogma. There are also photographers who don’t use it at all and still have great photos.
In any case, it’s certainly easy to use. As soon as you’re done shooting a photo, you check its histogram. Based on that, you move the exposure towards either the plus or the minus values. By doing this, you avoid taking overexposed and underexposed photos and make your subsequent photo editing work easier.


There are no comments yet.