How to Use the Histogram for Photo Editing
The histogram is one of the most important tools in photo editing. It helps you set exposure, contrast, and colors correctly, regardless of your monitor’s quality. Learn how to read a histogram, identify blown-out highlights, and edit your photos so they look great on any device.
In this article, you’ll learn:
- What the histogram is and how it works in Zoner Studio.
- How to adjust exposure using the histogram.
- How to detect overexposure and underexposure.
- How to increase contrast using the histogram.
- How to work with color channels.
- How to edit complex scenes (e.g., bright sky vs. dark ground).
A quick glance at the histogram shows the distribution of bright and dark areas in your image. This makes it easy to brighten, darken, or add contrast without relying on precise monitor calibration.
How to read the histogram in Zoner Studio
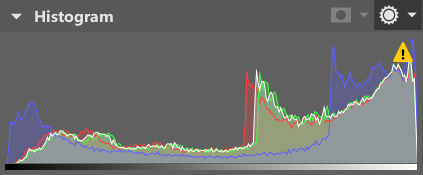
You can find the histogram in Zoner Studio in the top right corner of the Manager, Develop, and Editor modules.
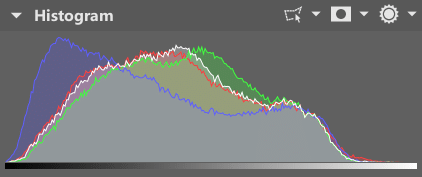
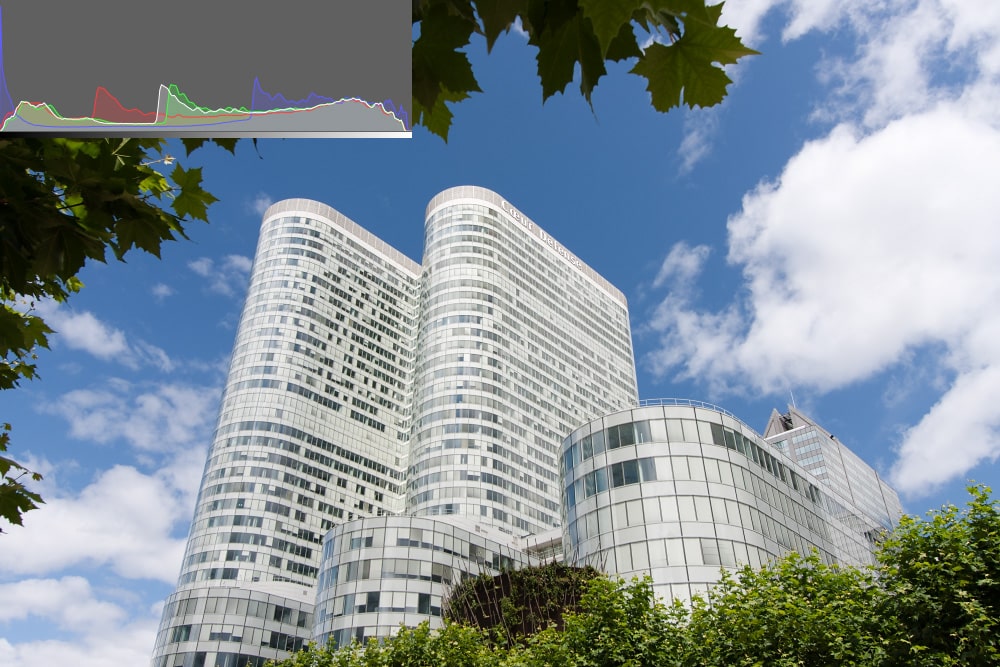
The histogram is a graph. The horizontal axis shows brightness levels from darkest to brightest. The vertical axis shows how many pixels fall into each brightness level. If you see a peak, it means a large number of pixels share that brightness level.
Although all the colors may look a bit complex at first, the histogram actually combines four graphs. In addition to overall brightness, it shows individual color channels. This makes it easier to spot issues in a specific channel that might not be visible when viewing the average of all channels.
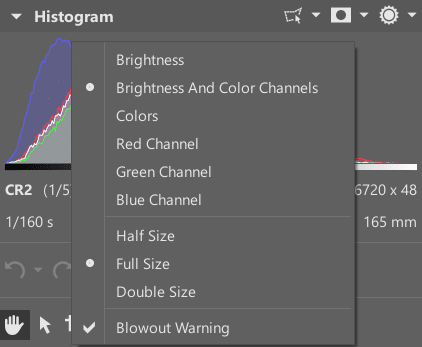
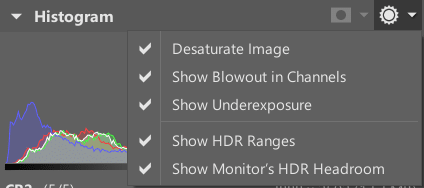
If the histogram feels too busy, right-click it to open a menu that lets you change the appearance of the graphs. You can hide color channels or remove the brightness component and display only individual channels.
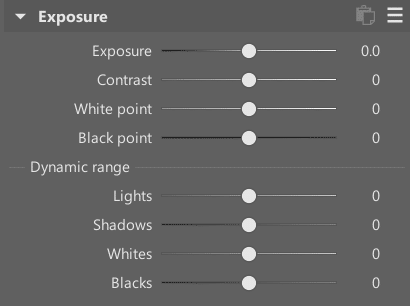
How to adjust exposure using the histogram
For most photos, the histogram should be spread across the range with most values near the middle. This usually means the image is properly exposed.
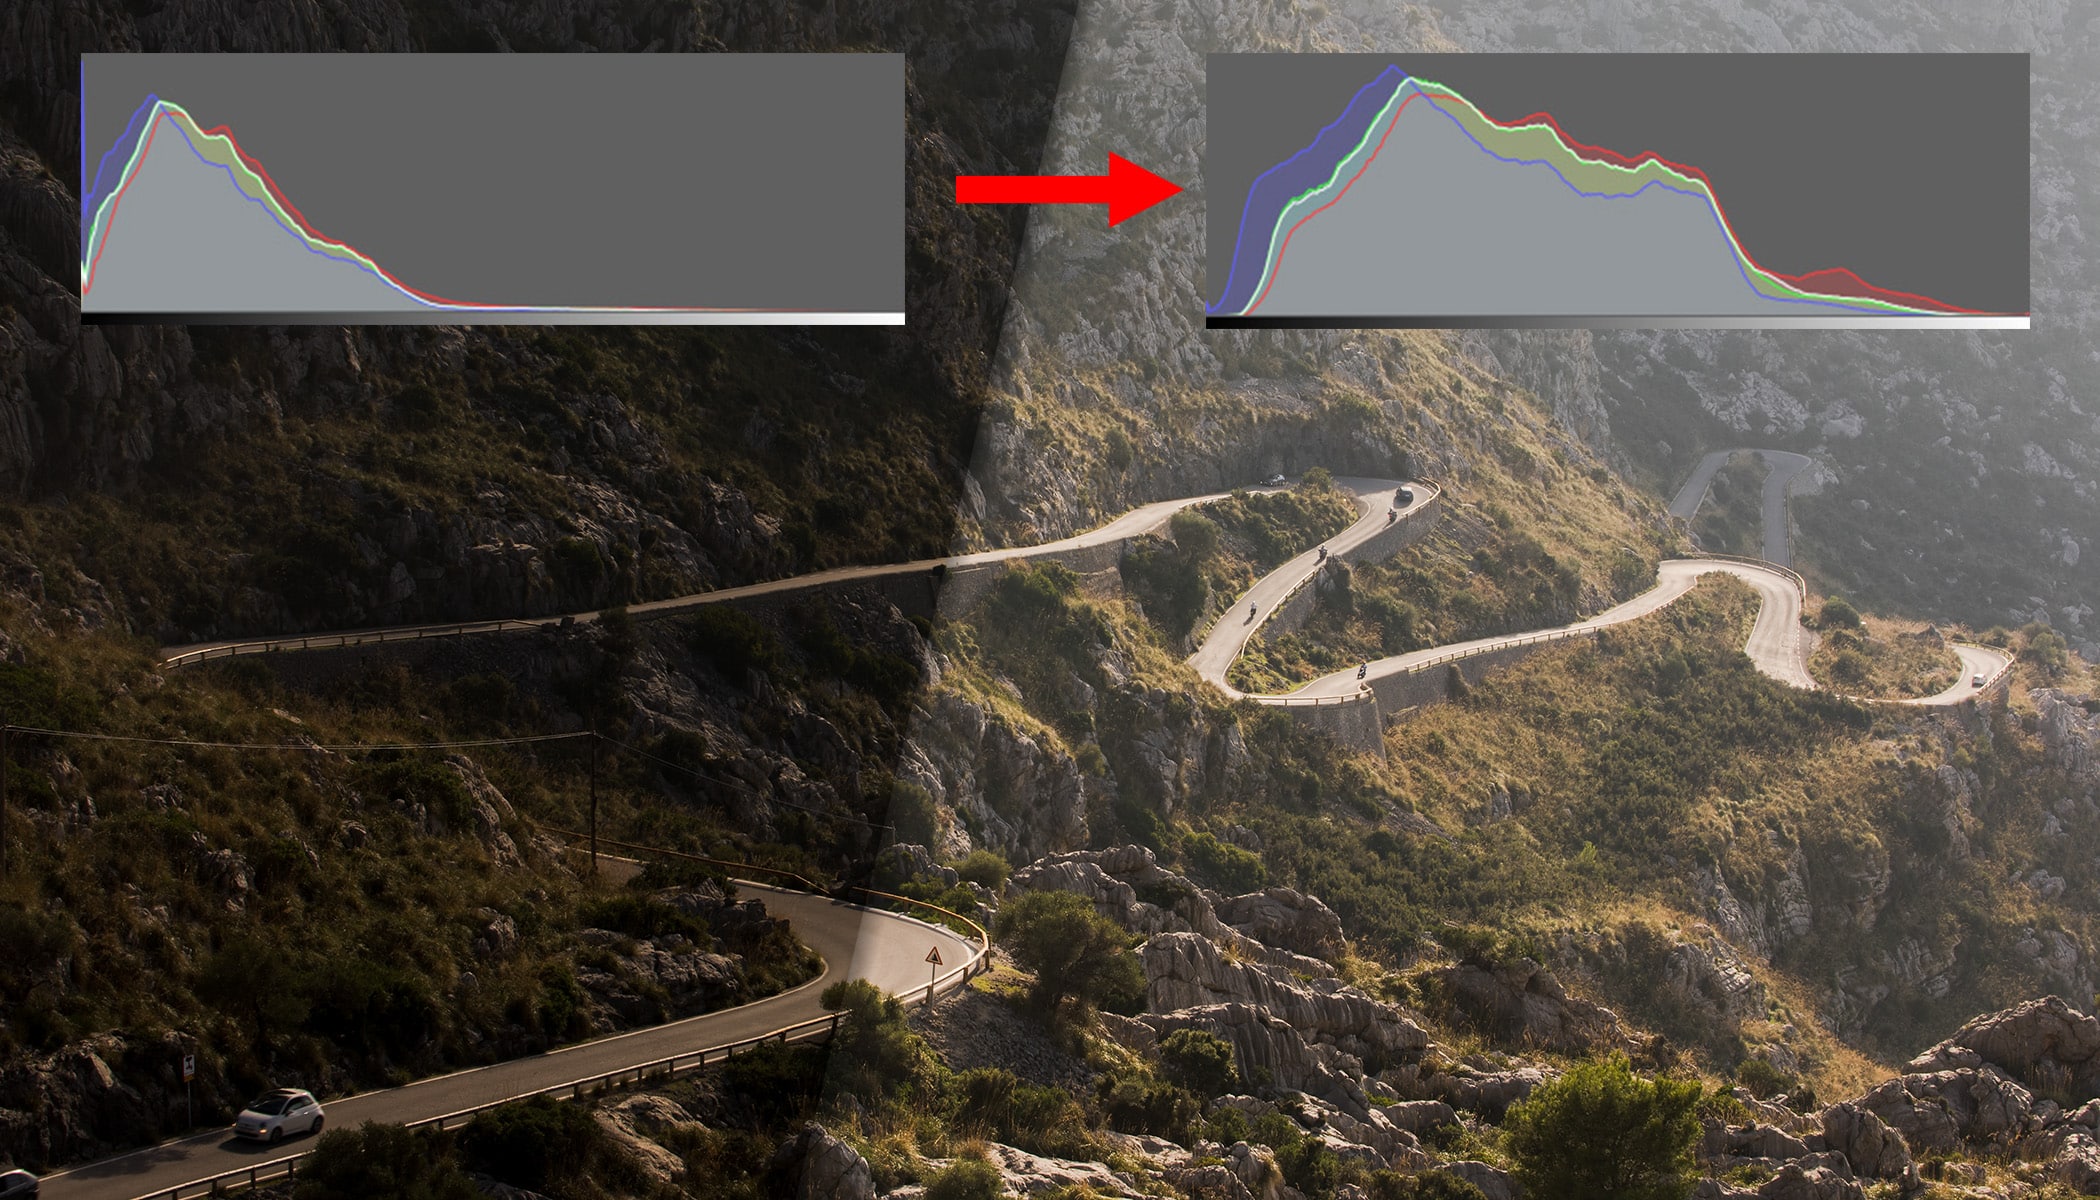
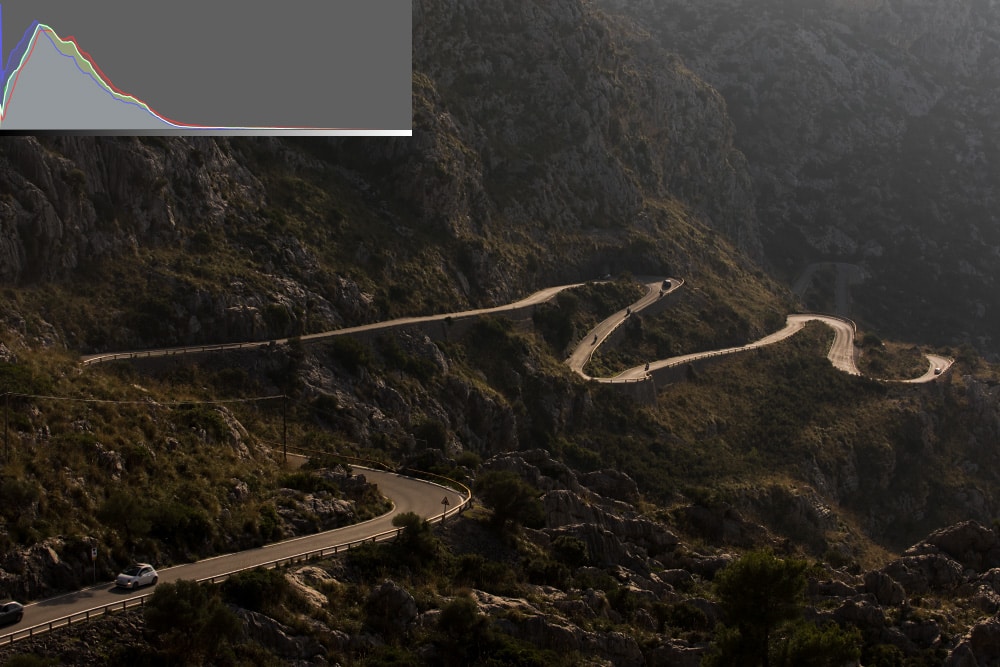
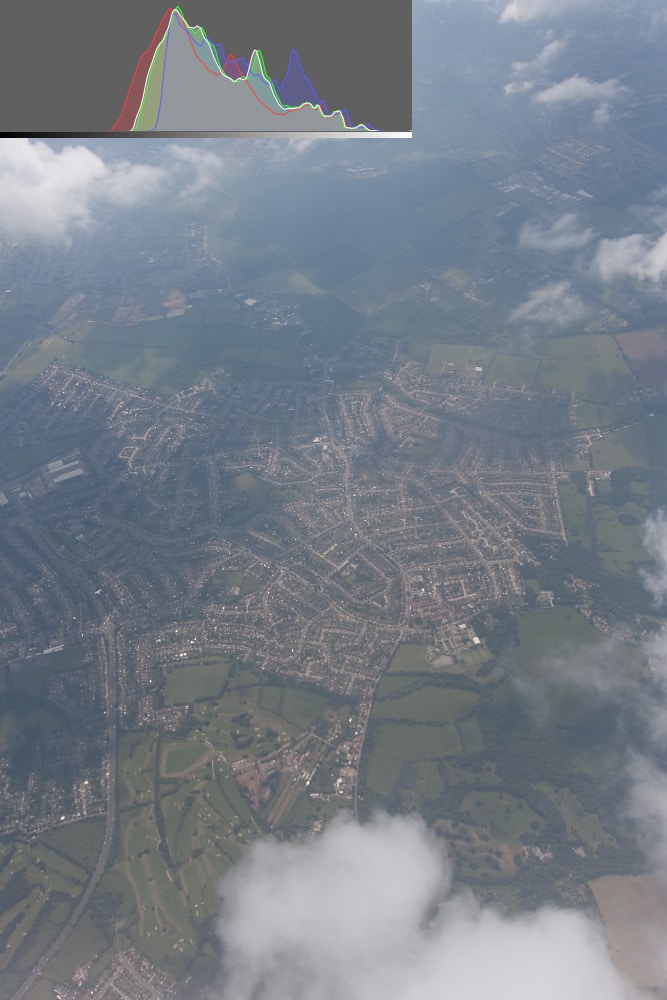
If the histogram leans too far to the left, the image is underexposed. Brighten it using the Exposure or Shadows sliders in the Develop module.
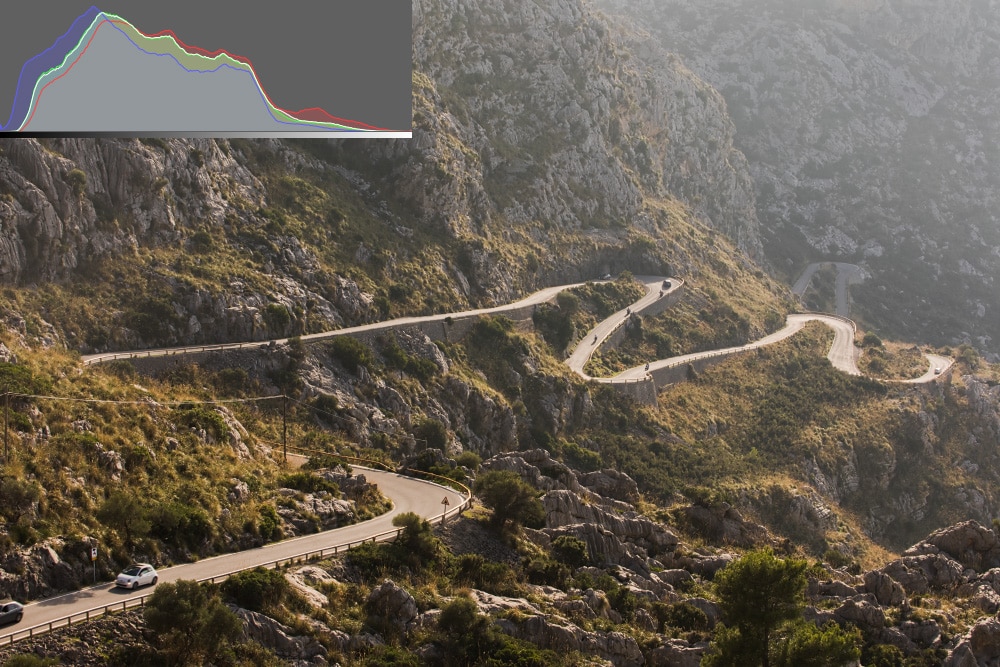
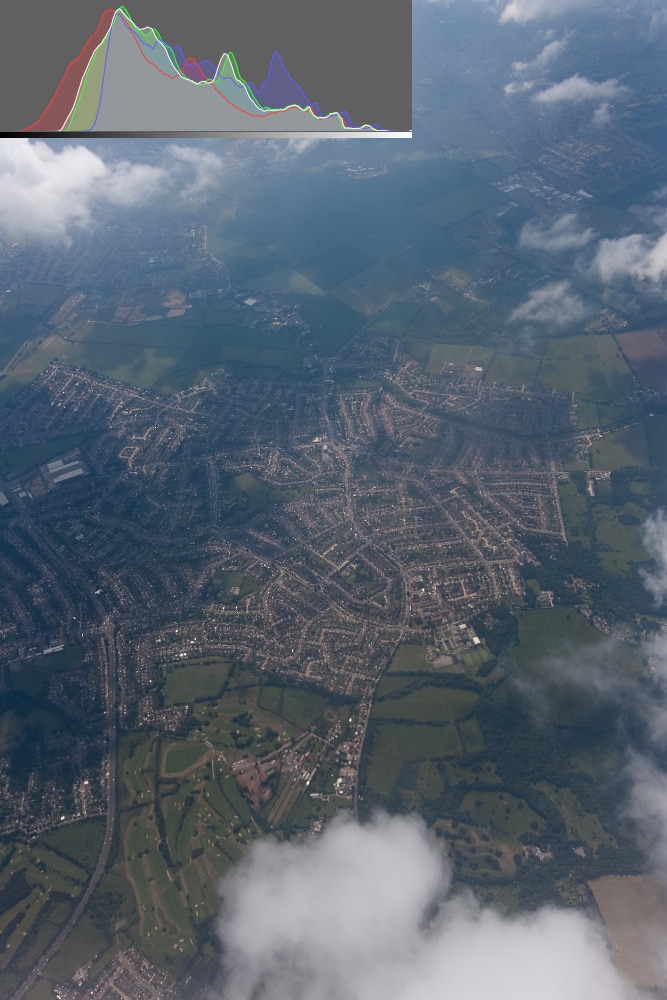
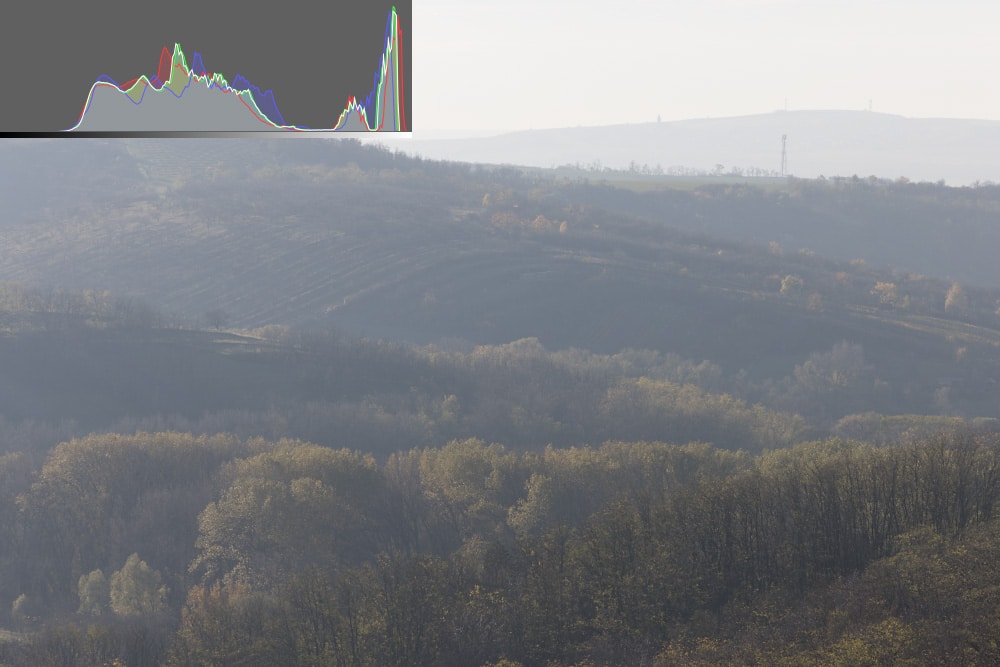
Below is a comparison of the original image with its original histogram and image after it was brightened. You can see that the histogram has shifted toward the center.
If a large part of the curve is pushed up against the right edge, the highlights may be blown out and colors will begin to blend into solid white. If this happens during editing, reduce the Exposure or Lights sliders to darken the image.
If it comes straight from the camera, you can try the aforementioned sliders, but recovery may be limited, and some areas may remain flat and without detail.
Not every photo should have a centered histogram. Night shots or high-key photos, where most of the image is very dark or very bright, naturally lean toward one side.

If you want as much freedom as possible when editing, shoot in RAW. RAW format preserves the maximum amount of image data and makes it much easier to correct both blown-out highlights and underexposed photos. Working with RAW is simple—read the article Beginner’s Guide: How to Develop RAW Images.
Identifying blowouts using the histogram
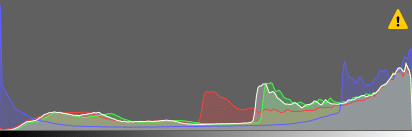
One of the histogram’s key uses is detecting overly bright areas or blowouts.
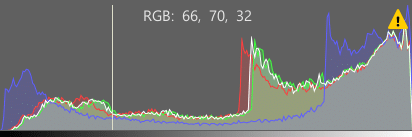
Right-click the histogram and enable Blowout Warning. This adds a warning icon when highlights are overexposed.
In the Develop and Editor modules, you can also click the gear icon to enable a preview that highlights problem areas directly in the image.
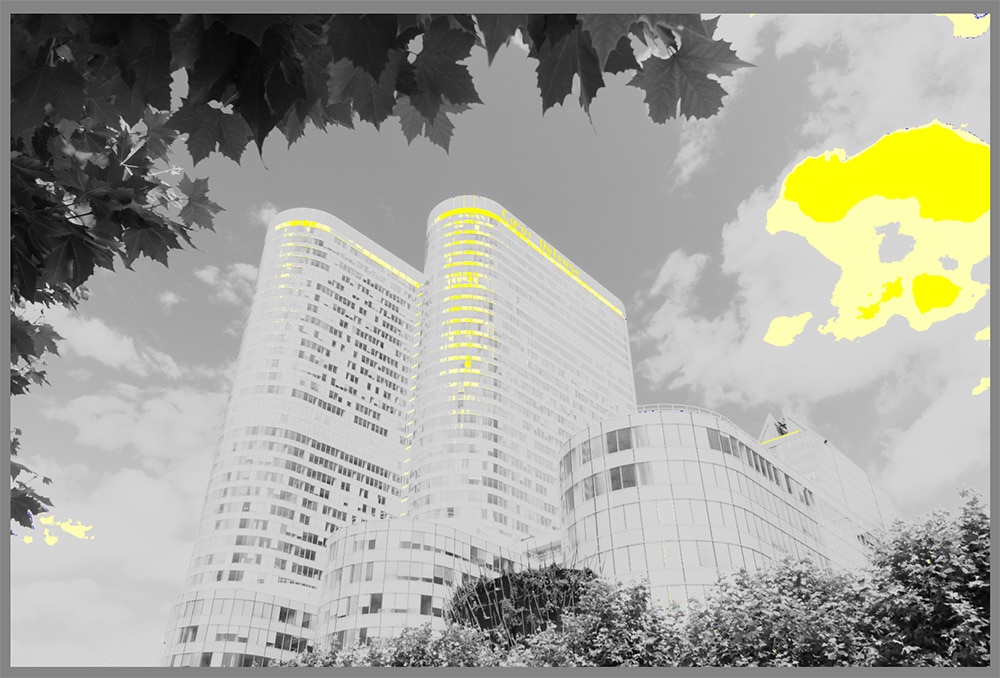
You can further customize this preview using the gear icon menu.
There are additional icons on the histogram in the Develop and Editor modules that are used to adjust the mask and selection to display.
Reading pixel values in the histogram
You can check the exact pixel values at any point in the image. Hover your cursor over the point, and the histogram shows the pixel’s position on the graph as well as the numerical values for each color channel.
Increasing contrast by stretching the histogram
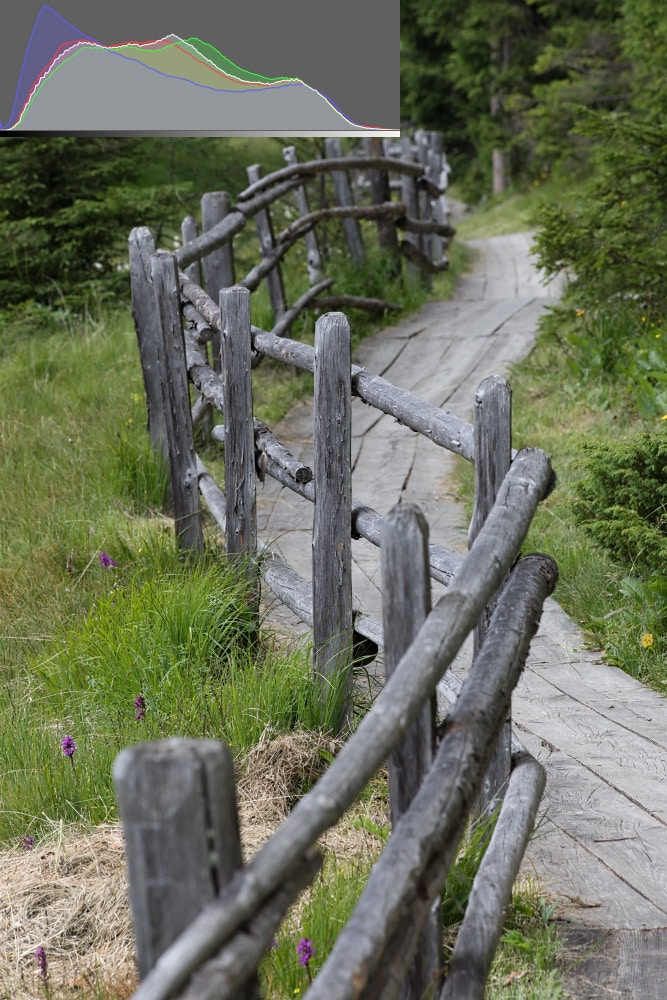
A common technique is “stretching” the histogram. This is particularly useful for low-contrast images like when shooting with a telephoto lens from a far distance, where haze creeps into the image.
The result is a histogram where both highlights and shadows are completely missing.
You can adjust Contrast, but it’s better to use Black point and White point, which are designed specifically for this purpose. The effect is the same as pulling on the left or right end of the histogram and trying to stretch it. Technically speaking, you’re changing the brightness of the pixels in the image, but the histogram reacts in exactly this way, so it’s known as stretching the histogram.
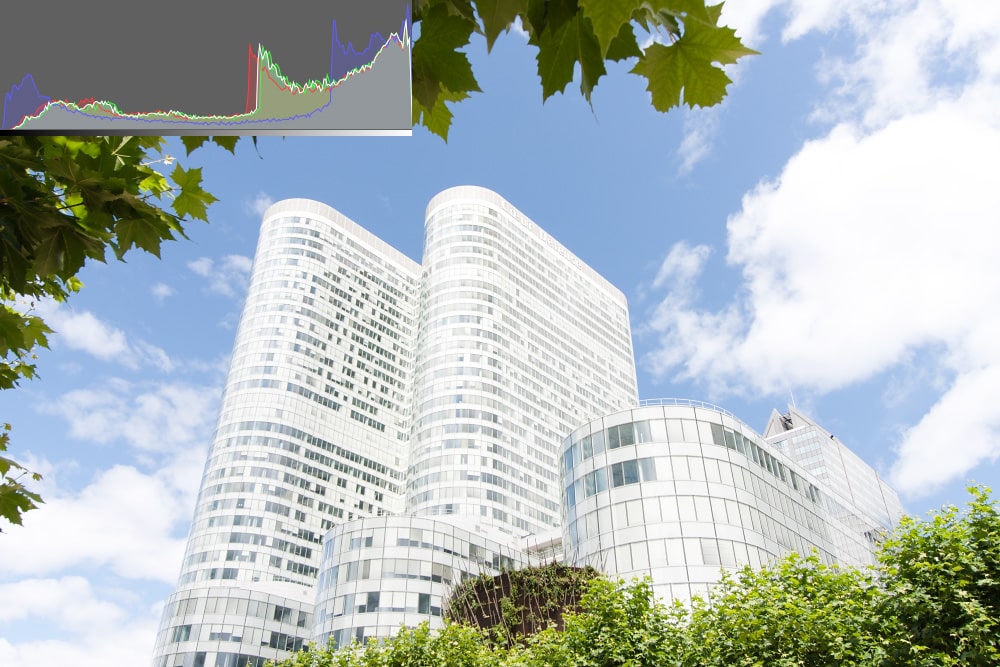
Editing photos with a bright sky and dark ground
The last scenario is a landscape photo that produces a histogram with two distinct peaks—one for the dark ground and one for the bright sky.
Depending on the situation, a simple fix is to increase Shadows and decrease Lights. For more control, use a Linear Gradient and adjust the mask, reducing Exposure for the bright sky.
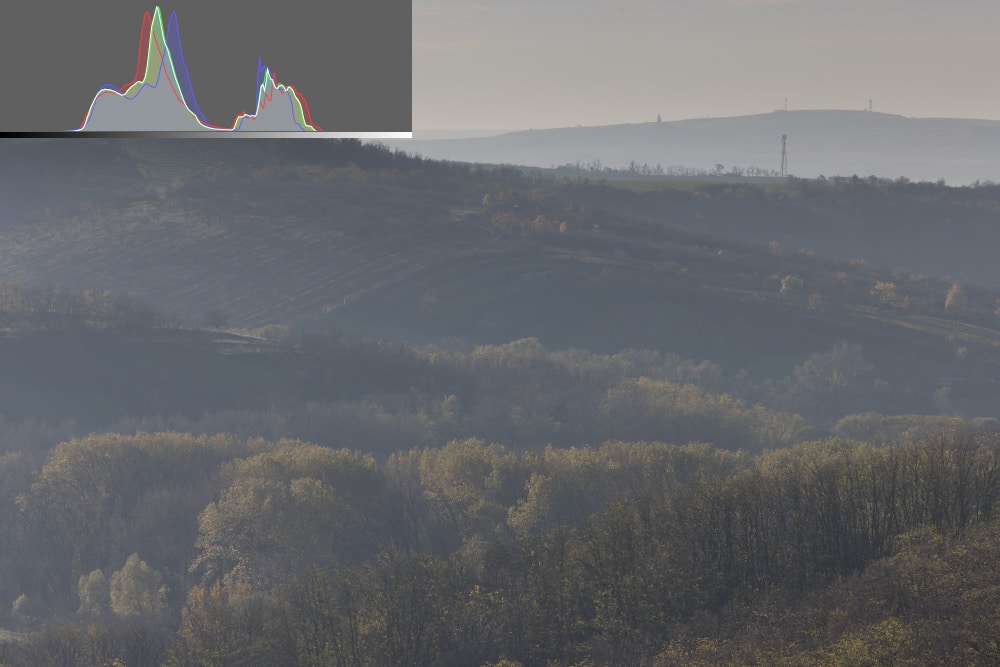
The histogram shows that tonal ranges that were originally very different have come closer together, making further adjustments easier. A common approach is to combine gradients with global adjustments to Lights and Shadows, and then fine-tune Black and White point as described above.
Why use the histogram when editing photos
If you haven’t worked with the histogram yet, now’s a good time to start. It won’t solve every problem, but it removes guesswork and gives you confidence that your photos will look the way you intended—no matter where they’re viewed.
FAQs
What is the histogram?
The histogram is a graph that shows the distribution of brightness in a photo, from darkest to brightest.
How can I use the histogram to tell that the exposure is off?
If the graph is heavily shifted to the left, the photo is underexposed. If it’s shifted to the right, it likely contains blown-out highlights.
What does it mean if the histogram touches the edge?
It indicates a loss of detail—on the left in the shadows, and on the right in the highlights.
Is the perfect histogram always centered?
No. Some scenes like night shots or high-key images naturally produce skewed histograms.
How can I increase contrast using the histogram?
Adjust Black and White point to “stretch” the histogram across the full range.
Why use the histogram when editing?
Because it’s not affected by monitor quality and provides objective exposure information.
There are no comments yet.